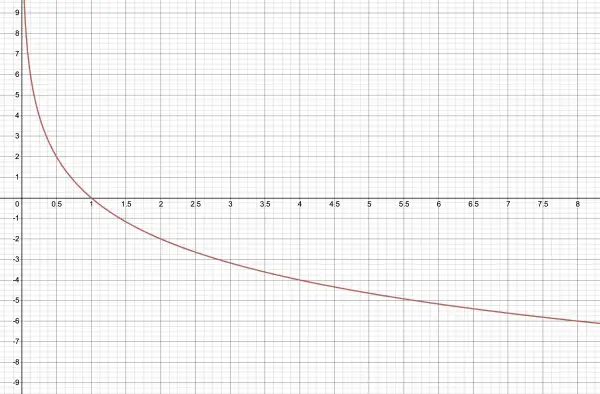
y=2log½(x), y=-2log2(x), y=2log2(1/x) are all equivalent.
To help you plot the graph, we pick values of x which are powers of 2:
x y
½ 2
1 0 (x-intercept)
2 -2
4 -4
8 -6
16 -8 (not shown on this graph)
Note that the y-axis is an asymptote and that when x<1 y is positive.