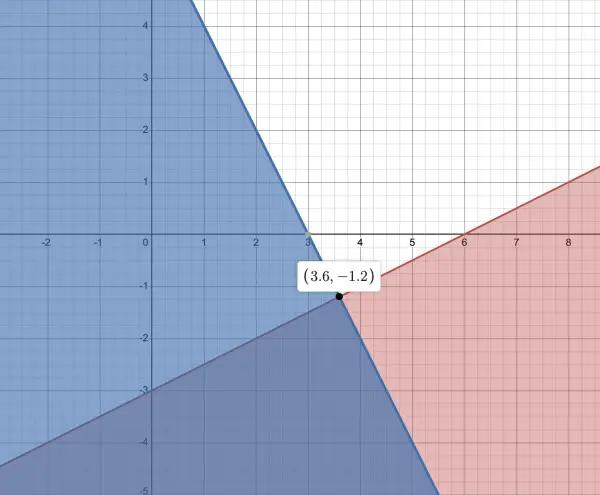
The red line and shaded area is the inequality x-2y≥6; the blue line and shaded area is 2x+y≤6. Inequalities are represented by areas, hence the shaded areas. The darker shading is the area (including the area beyond the confines of the graph) in which both inequalities are satisfied. All points, that is, all x-y values in this area obey both inequalities. The intersection point (3.6, -1.2) represents the extreme point when x-2y=2x+y=6, In this area all y values are less than -1.2 but there is no constraint on x values. For example, when x=-2, y=-4, x-2y=6 and 2x+y=-8 (<6) (on the red line, but to the left of the blue line in the dark shaded region). Another example: when x=6, y=-6, x-2y=18 (>6) and 2x+y=6 (on the blue line, but below the red line in the dark shaded region).