i need it to be graphed.

in Algebra 1 Answers by

Your answer

Your name to display (optional):
Privacy: Your email address will only be used for sending these notifications.
Anti-spam verification:
To avoid this verification in future, please log in or register.

1 Answer

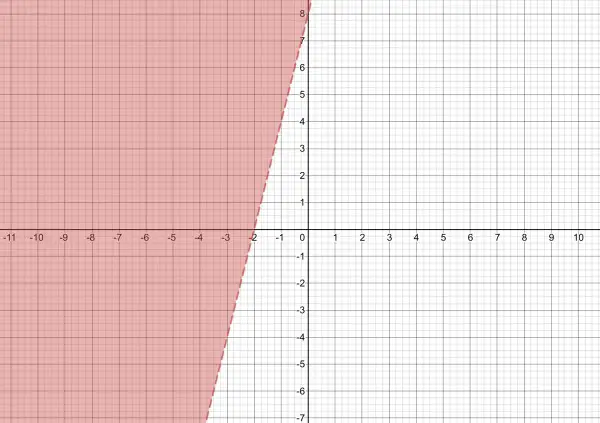
To draw the graph, find the intercepts and draw a line through them.

Put x=0 to find the y-intercept: ½y>4, so y>8. This shows where the broken line meets the y-axis and tells you that the shading is greater than (0,8), which is the area above the line.

Put y=0: 0>2x+4, -4>2x, -2>x, or x<-2. So -2 is the x-intercept and the shading is to the left of x=-2.

The broken line joins the intercepts.

by Top Rated User (1.2m points)

Related questions

1 answer
1 answer
1 answer
1 answer
asked Sep 11, 2013 in Algebra 1 Answers by anonymous | 750 views
1 answer
1 answer
1 answer
asked Dec 11, 2012 in Algebra 2 Answers by anonymous | 821 views
3 answers
asked Feb 23, 2012 in Algebra 1 Answers by anonymous | 1.3k views
1 answer
asked Feb 14, 2012 in Pre-Algebra Answers by anonymous | 2.1k views
1 answer
Welcome to MathHomeworkAnswers.org, where students, teachers and math enthusiasts can ask and answer any math question. Get help and answers to any math problem including algebra, trigonometry, geometry, calculus, trigonometry, fractions, solving expression, simplifying expressions and more. Get answers to math questions. Help is always 100% free!
87,516 questions
100,279 answers
2,420 comments
732,245 users