A: Set up the inequality system.

B: Graph it.

in Algebra 1 Answers by

Your answer

Your name to display (optional):
Privacy: Your email address will only be used for sending these notifications.
Anti-spam verification:
To avoid this verification in future, please log in or register.

1 Answer

Let A be the number of Plant A plants and B the number of Plant B plants.

First inequality: A+B≥8. The total cost of the plants = 6A+10B and cannot exceed $60, so the second inequality is 6A+10B≤60, which simplifies to 3A+5B≤30.

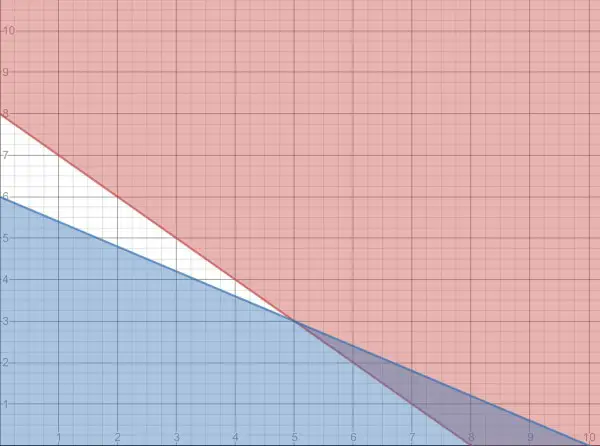
In the above graph Plant B is the vertical axis and Plant A the horizontal axis.

The pink line and shading represents the quantity of the plants while the blue line and shading represents the cost of the plants. The dark shading is the region where both inequalities are true. The intersection of the lines is where equality is satisfied, that is, A+B=8 and 6A+10B=60. This happens when A=5 and B=3. The rest of the dark shaded area above the horizontal axis contains all the values of A and B where both inequalities are satisfied.


by Top Rated User (1.2m points)

Related questions

Welcome to MathHomeworkAnswers.org, where students, teachers and math enthusiasts can ask and answer any math question. Get help and answers to any math problem including algebra, trigonometry, geometry, calculus, trigonometry, fractions, solving expression, simplifying expressions and more. Get answers to math questions. Help is always 100% free!
87,516 questions
100,278 answers
2,420 comments
730,749 users