Let x=number of engines for Plant I and y=number of engines for Plant II.
The constraints are represented by border lines on the diagram.
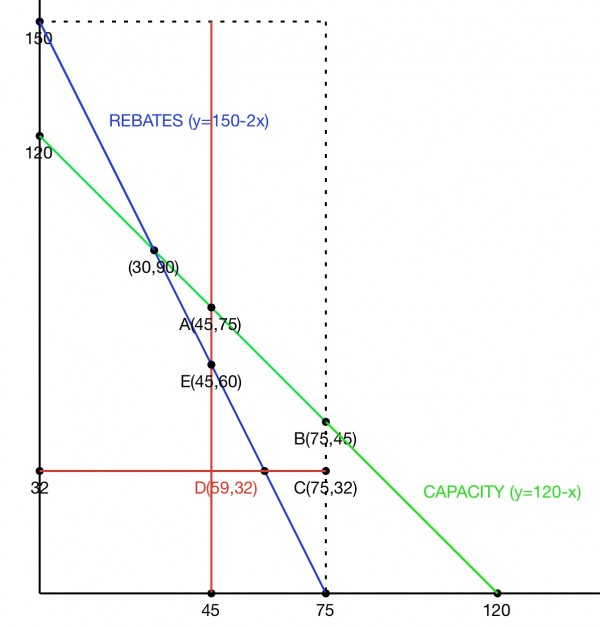
The red lines indicate the first constraint concerning the minimum number of engines for each plant. The area to the right of the vertical red line signifies x≥45, while the area above the horizontal red line signifies y≥32.
The manufacturer’s production capacity is that x+y≤120, represented by the area under the green capacity line. Combining these first two constraints, we have the area ABCD. The shipping costs in total are 30x+50y.
The rebate constraint is 20x+10y≥1500, which reduces to 2x+y≥150, represented by the area above the blue line.
Combining all the constraints we have the area of ABCDE. The values of x and y must reside in this area.
If we calculate the shipping costs 30x+50y for each vertex of the figure we get:
A=$5100, B=$4500, C=$3850, D=$3370 and E=$4350.
So D has the minimum total shipping costs, when Plant I has 59 engines ($1770 shipping costs) and Plant II has 32 engines ($1600 shipping costs). The manufacturer receives exactly $1500 in rebates.