2) What situations might make one representation more useful than another?Explain the relationships between the equation, the table, and the graph. How does each one describe the situation?
in Algebra 1 Answers by

Your answer

Your name to display (optional):
Privacy: Your email address will only be used for sending these notifications.
Anti-spam verification:
To avoid this verification in future, please log in or register.

1 Answer


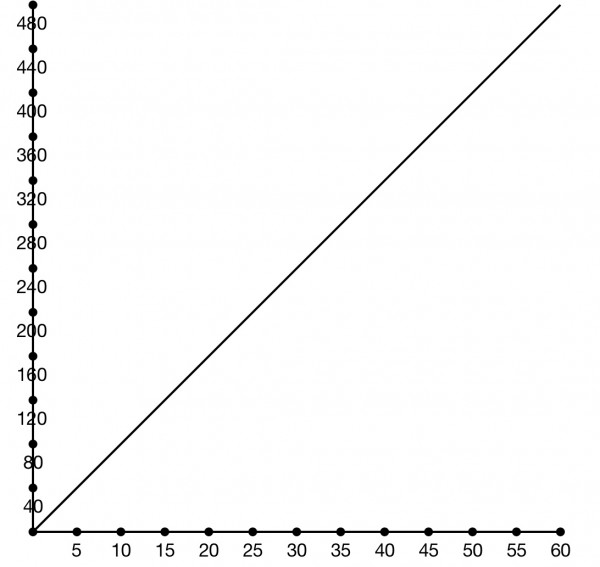
The above graph is an example of how you might want to draw the graph of y=8x on graph paper. The x axis is the hours worked and the y axis the pay received.

x hours  $y pay
10 80
20 160
30 240
40 320
50 400
60 480

The  table shows some of the values, and each row of the table corresponds to a point on the line.

The graph is better than the table for filling in the gaps that occur in the table. But the table gives accurate values. The equation gives the means to determine exact values, but it requires you to do a calculation, while the graph values can be read off from the coordinates without having to do any calculations.


by Top Rated User (1.2m points)

Related questions

2 answers
Welcome to MathHomeworkAnswers.org, where students, teachers and math enthusiasts can ask and answer any math question. Get help and answers to any math problem including algebra, trigonometry, geometry, calculus, trigonometry, fractions, solving expression, simplifying expressions and more. Get answers to math questions. Help is always 100% free!
87,516 questions
100,279 answers
2,420 comments
732,159 users