The mathematical equation for the warhead's height after time t seconds is h=490000-4107t. At t=0, h=490000.
The intercepting missiles are delayed by 10 seconds so the equation for their height is h=6115(t-10) so that when t=10, h=0. The warheads and interceptors are assumed to moving at uniform velocity, so graphically the height equations for both missiles are straight lines. Where they cross represents interception, which must take place before the warheads explode at h=16000. t=(490000-16000)/4107=115.41secs.
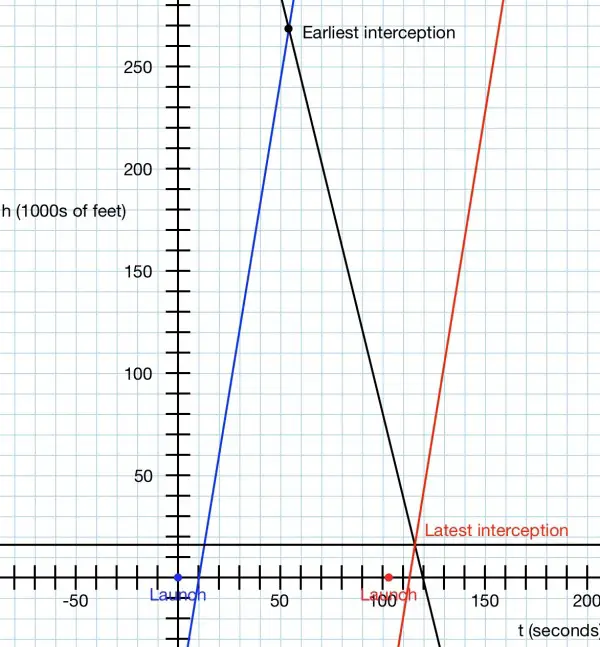
To find out the earliest time for interception we have 6115(t-10)=490000-4107t, when the missile and interceptor are at the same height. 6115t-61150=490000-4107t; 10222t=551150, t=53.92 secs. (h=268,550.56 ft approx.)
The latest time for interception is t=115.41 secs when the missiles explode. To reach a height of 16000 feet it takes the interceptor 16000/6115=2.62 seconds. Add on the 10 seconds to launch=12.62 secs. It takes the missile 115.41 secs to reach 16000 feet so the interceptor must be launched no later than t=115.41-12.62=102.79 seconds.
To illustrate this using Excel we could draw the two graphs initially, h being the vertical axis and t the horizontal: h=490000-4107t and h=6115(t-10). This represents the earliest time of interception. Then we need to "slide" h=6115(t-10) to the right to cross the other graph where h=16000. Where this shifted graph intercepts the t axis should correspond to 102.79 seconds. Some scaling down will be necessary for h perhaps measuring height in 1000's or 10000's of feet. The t axis should be scaled to accommodate about 120 seconds and of course the origin is on the extreme left.
If a graph is not used, Excel formula should be used to create a table of h and t values suitably spaced.
=IF(A1<10,0,6115*(A1-10)) can be used as a formula for the interceptor.
=IF(490000-4107*A1<16000,16000,490000-4107*A1) can be used as a formula for the missile. The graph can be inserted using the tabulated data.
Cell A1 contains t, so column A contains all the values of t you want to use. B1 and C1 correspondingly contain data for h for the two lines.