And also draw the graph the function and also check the diiffrentibilti
in Calculus Answers by

Your answer

Your name to display (optional):
Privacy: Your email address will only be used for sending these notifications.
Anti-spam verification:
To avoid this verification in future, please log in or register.

1 Answer

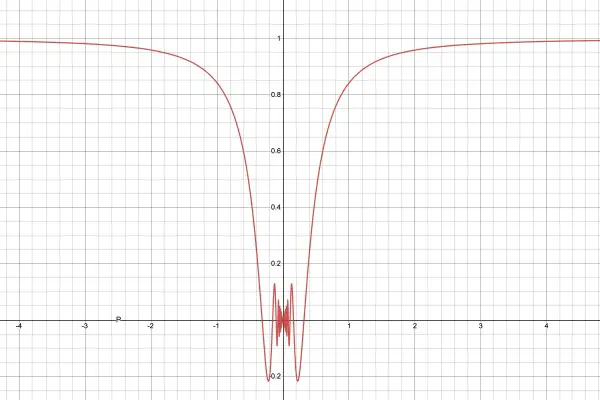
We need to look at the behaviour of the function f(x)=xsin(1/x). When x is very large, 1/x is very small and we can expand sin(1/x)=1/x approx. xsin(1/x)=1 approx as x→±∞. Therefore y=1 is an asymptote. When x is small, 1/x becomes larger but, since the upper and lower limits of sine are -1 and 1, xsin(1/x)→0 as x→0. When x=0, f(0)=0 (given) so the limit of xsin(x) is the same as f(0), and continuity is preserved. As x→0, the amplitude of the sine wave decreases rapidly and so does the period (wavelength), hence the graph above.

by Top Rated User (1.2m points)

Related questions

1 answer
asked Mar 12, 2014 in Calculus Answers by math, math problem, calculus, calculus p | 1.5k views
1 answer
1 answer
asked Apr 8, 2020 in Calculus Answers by qwertykl Level 2 User (1.4k points) | 921 views
1 answer
asked Dec 14, 2017 in Calculus Answers by Jill | 447 views
1 answer
asked Nov 26, 2012 in Calculus Answers by anonymous | 693 views
Welcome to MathHomeworkAnswers.org, where students, teachers and math enthusiasts can ask and answer any math question. Get help and answers to any math problem including algebra, trigonometry, geometry, calculus, trigonometry, fractions, solving expression, simplifying expressions and more. Get answers to math questions. Help is always 100% free!
87,516 questions
100,279 answers
2,420 comments
731,344 users