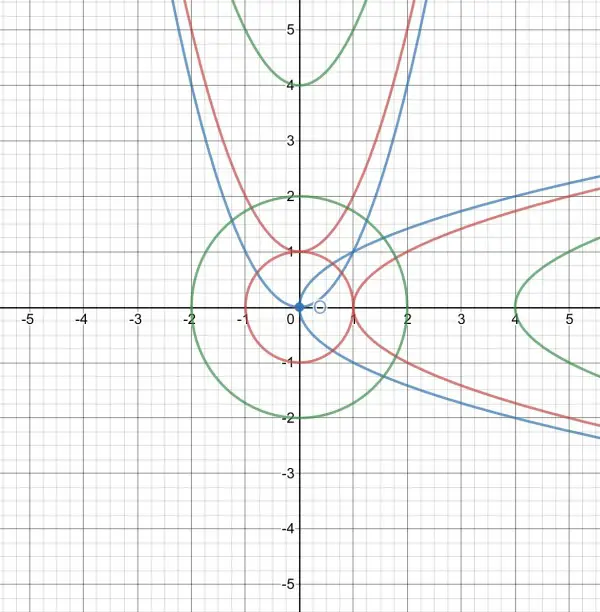
Because of system limitations I have provided three graphs in one for the plane traces. The colour-coding is:
blue: 0; red: ±1; green: ±2 (or red is y=1, green is y=4).
The xy traces are the vertical parabolas, the yz traces are the sideways parabolas, and the xz traces are the circles (where blue is the point O(0,0)).
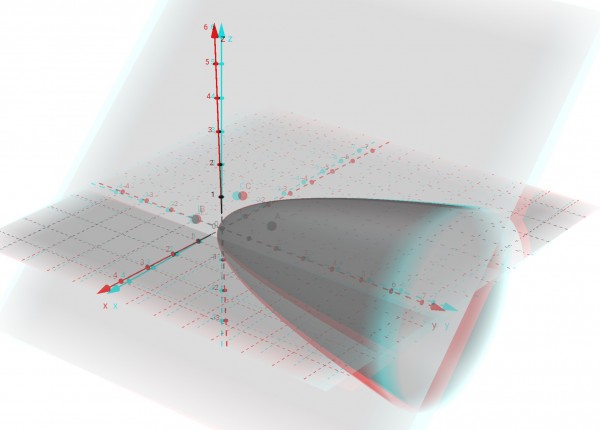
The 3D view of the surface can be viewed using 3D glasses (right eye is green or blue; left eye is red). A(-1,1,0) is on the hidden side and O(0,0,0) is the origin, the minimum point of the surface.
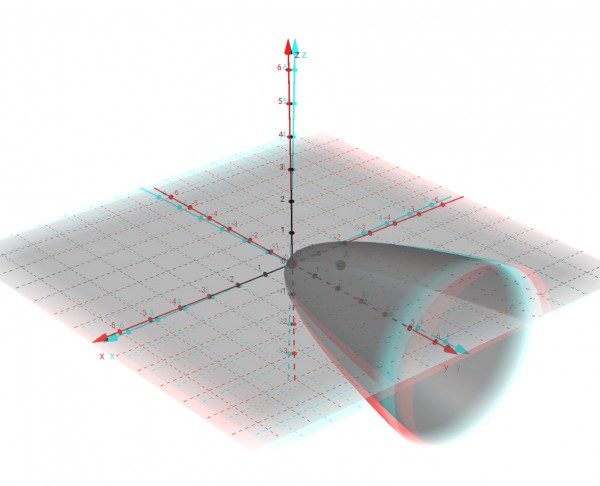
F(x,y,z)=x²-y+z²
∇(x,y,z)=<2x,-1,2z> (sloping plane); ∇(0,0,0)=<0,-1,0> (point B); ∇(-1,1,0)=<-2,-1,0> (point C).