Actual values on the graph are to a maximum of 3 decimal places accuracy.
| x |
2x |
log10(2x) |
| -2 |
0.25 (¼) |
-0.60 |
| -1 |
0.5 (½) |
-0.30 |
| 0 |
1 |
0 |
| 1 |
2 |
0.30 |
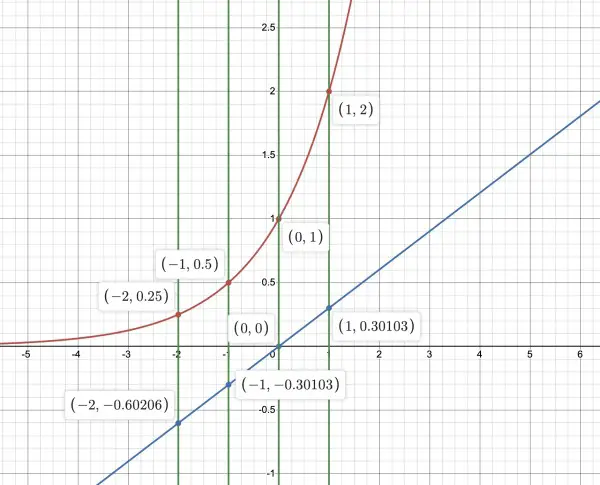
Values in the table are plotted to approximately 2 places of decimals.
The red graph is 2x and is curved; the blue graph is log(2x) (base 10) and is linear.
Let y=g(x)=log(2x)=xlog(2)=0.301x approximately, which is linear. 10g(x)=10y=2x is another way of expressing the function g.
Taking logs to base 2 we get: ylog2(10)=x, and log2(10)=1/log10(2)=1/0.30103=3.32193 approx.