We need to complete the squares for x and y:
x2-6x-4(y2+8y)-64=0,
x2-6x+9-4(y2+8y+16)-64=0+9-64 completes the squares and balances the equation by adding to the right-hand side what we also added to the left to complete the squares:
(x-3)2-4(y+4)2=9-64+64=9. This tells us what type of graph we have (a horizontal hyperbola) and where its centre is. We can use the centre as the origin of the axes of the hyperbola, which makes it easier to do other calculations, if we use these axes as reference lines. We can also tell the distance between the vertices of the hyperbola and the new origin. √9=3 is that distance, as we can see by plugging in y=-4 to cancel the y-term:
When y=-4, (x-3)2=9=32, so x-3=±3, that is, x=+3-3=0 and x=+3+3=6. y=-4 for both of these x-intercepts on the new axes, so on the original axes the vertices are at (0,-4) and (6,-4). The point O(3,-4) is the location of the new origin, which is also the centre of the hyperbola.
The general equation for a horizontal hyperbola is x2/a2-y2/b2=1 when the hyperbola has its centre at the origin of the axes. We need to find a and b, and to do this we need to divide through by 9 so that we have 1 on the right-hand side of the equation:
Let X=x-3 and Y=y+4 we can write the equation of the hyperbola using the new reference frame: X2/a2-Y2/b2=1, so we have X2/9-4Y2/9=1. Using X and Y we distinguish the new reference frame from the usual x-y frame.
So 1/a2=1/9, making a2=9; 1/b2=4/9, making b2=9/4. The focal length c=√(a2+b2)=√(9+9/4)=(3/2)√5 or 1.5√5. The foci in the X-Y reference frame are at (-c,0) and (c,0), that is, (-1.5√5,0) and (1.5√5,0). These lie on the transverse axis, which is the X-axis (X-Y reference frame) because the Y coordinate is zero. Since we know that X=x-3, then x=X+3, and Y=y+4, then y=Y-4, we can adjust to the x-y reference frame. The foci are at:
F1(3-1.5√5,-4) and F2(3+1.5√5,-4) in the x-y frame.
The asymptotes in the X-Y frame are found through:
X2/9-4Y2/9=0, X2=4Y2, so X=2Y and X=-2Y in the X-Y frame;
x-3=2(y+4), x-3=2y+8, x-2y=11; x-3=-2(y+4), x-3=-2y-8, x+2y=-5 are the asymptotes.
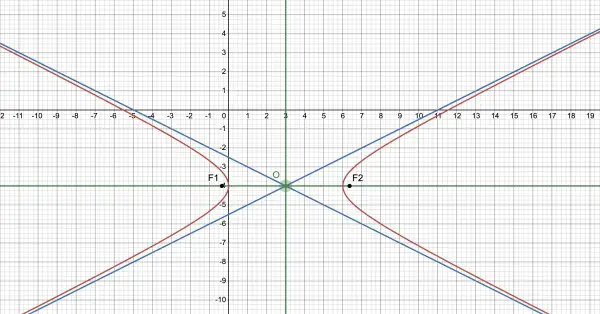
The picture shows the hyperbola in red, the X-Y reference frame axes in green, the asymptotes in blue.
The points O (centre and X-Y origin), F1 (lleft focus), F2 (right focus). The graph should make it easier to follow the above logic.