F(t)=1+25t2-t3 tells us how many children contract flu in a given time t days after infection.
(i) F(12)=1,873, the number of flu cases around the 12th day.
F'(t)=50t-3t2 tells us the rate of contraction (number of children per day).
(The images in the question don't display.)
When F'(t)=0 we can find the maximum or minimum rate. 50t-3t2=0 when t(50-3t)=0, that is, when t=0 or 50/3 days (about 17 days). (This answers (iii), indicating when we have maximum and minimum conditions. At the maximum and minimum the rate of change is zero. After the minimum the rate increases up to maximum and then declines.)
F"(t)=50-6t can be used to determine which is maximum and which is minimum.
F"(0)=50 is a positive number which means minimum. F"(50/3)=50-100=-50 is a negative number implying maximum. (This answers (ii).)
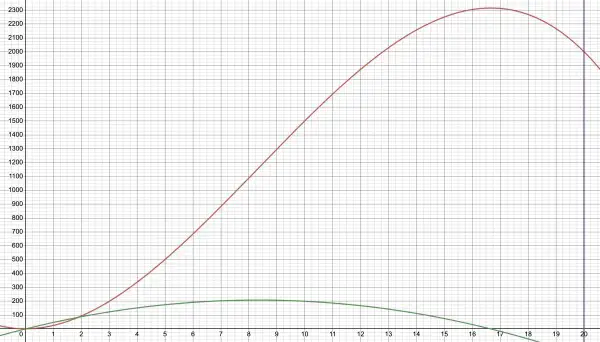
The red curve below represents F(t). The vertical line represents the maximum value of t and the F(t) axis (y-axis) is the minimum value of t (starting point--exposure). At t=16⅔ days after exposure the maximum number of children who have contracted flu reaches its maximum at about F(16⅔)=2,316 children, which is the point where the green first-derivative curve intersects the t-axis. F(0)=1 is the minimum (0,1).