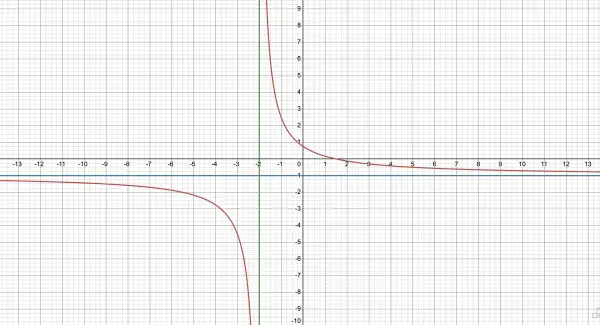
The red curves are the graph of f(x). Every point on these curves (which extend beyond the page) represents a solution to f(x). The green and blue lines are not parts of the actual graph: they just show the vertical and horizontal asymptotes. The vertical asymptote corresponds to x=-2 when the denominator would become zero, so f(-2) is undefined (it's ±∞). The horizontal asymptote (y=-1) is the line that f(x) approaches as x gets larger negatively or positively.