You haven’t supplied any data so all that can be given is a general answer to part 1.
Suppose the initial concentration is c mg/mL and the concentration is checked every hour. If t is the number of hours and x is the concentration in the bloodstream after t hours then one equation could be x=crᵗ where r is the rate of reduction and 0<r<1. This is a non-linear equation, which can also be written in the form x=ce⁻ˢᵗ where s=ln(r), a negative quantity in this case, because r<1.
Statistical regression is usually in the linear form x=c+rt, where c is the approximate initial dose concentration and r a number (negative in this case) and r is a (decreasing) rate. Unlike x=crᵗ, this linear equation will eventually become zero after -c/r hours (r is negative), whereas the other equation never becomes zero, although it will decrease beyond measurability.
A table of values of concentration x with corresponding t values enables us to establish a “best fit” relationship between x and t. To do this we need to find the mean x value and the mean t value. In this case, t is likely to be 1, 2, 3, ... hours, but it doesn’t have to be an exact numbers of hours, from a statistical point of view. We also need the variance (a measure of how each measurement deviates from the mean). In the linear equation r is expected to be negative as the medication is distributed through the body. If r were to be close to zero, the concentration would be too random to predict. The closer r is to -1 (in this case), the more reliable a prediction would be for any time t.
A similar pattern for linear regression applies to part 2, but in this case the regression coefficient is likely to be greater than 0 since the number of Internet hosts is likely to increase with time t.
In the equations below, a and b are the constants in the linear equation y=ax+b. So if x=c+rt, r=a and c=b. That is, the slope a is the rate of medication distribution r, and the intercept b is the initial value of the concentration c. (x,y) correspond to (t,x) values from your tables.
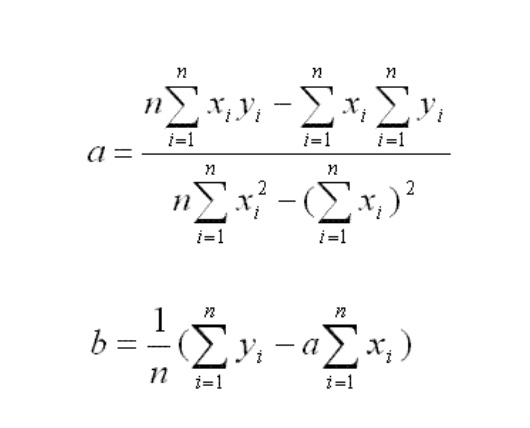
The calculations involved are especially tedious if n (the number of (x,y) pairs) is quite large, but many scientific calculators do the hard work for you. You just input the x and y values from a table.