The picture below shows the actual curve for the function in red with the approximate figures in blue to indicate how close the approximation is.
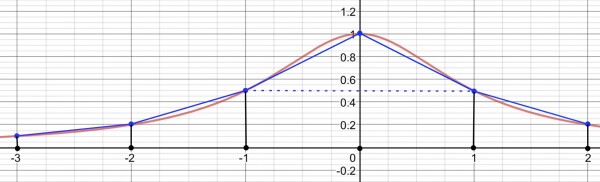
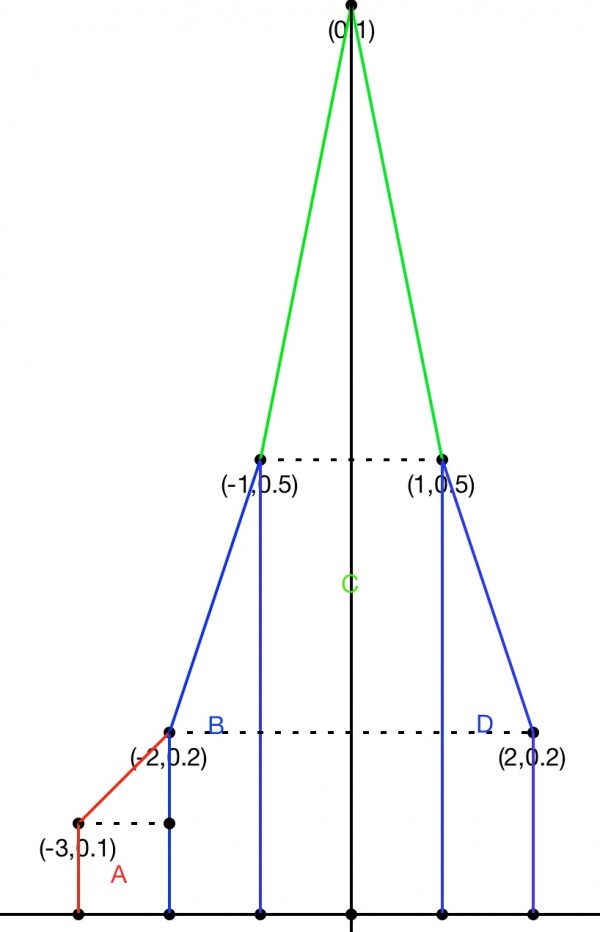
I guess this is to do with approximating the area under a curve by summing the areas of trapezoids and other simple figures. In the picture the values of x between -3 and 2 and points on the curve (not shown) have been plotted to form trapezoids. Red area A and blue areas B and D are trapezoids. The central area green C has a green isosceles triangle atop a rectangle. Areas B and D are the same.
Area A=0.1 (rectangle) + 0.05 (triangle) = 0.15
Area B=0.2 (rectangle) + 0.15 (triangle) = 0.35
Area C=1.0 (rectangle) + 0.5 (isosceles triangle) = 1.5
Area D=0.35
Total area=0.15+0.35+1.5+0.35=2.35.
Actual area under the curve is ∫dx/(x²+1)=[arctan(x)] ²₋₃=arctan(2)-arctan(-3)=2.3562 approx. 2.35/2.3562=0.9974. So the error of the approximation is about 0.26%.