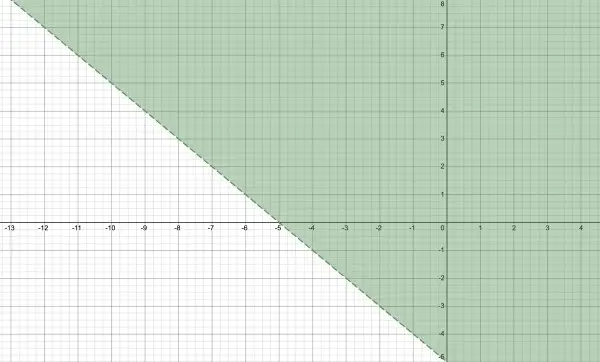
The shaded area represents the inequality. Note the x and y intercepts at -5. This is a clue on how to draw the graph. Draw a line through the intercepts to create the border, shown as a broken line. The area to the right of this line (and beyond) represents y>-x-5.