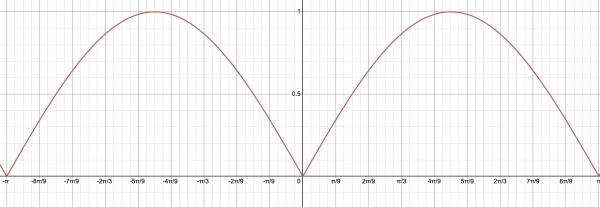
I guess you want the graph of the function f(x). This is shown above. π is another way of expressing 180°. The graph shows values of x between -180° and 180° in steps of π/9=20°.
f(x) is continuous but not differentiable over this interval (the slope switches abruptly between negative and positive around x=0).