Make an easy table of values
| x |
y |
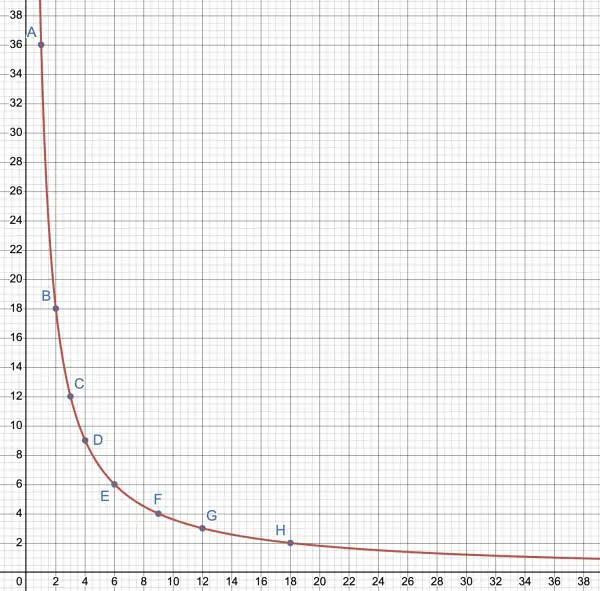
| 1 |
36 |
| 2 |
18 |
| 3 |
12 |
| 4 |
9 |
| 6 |
6 |
| 9 |
4 |
| 12 |
3 |
| 18 |
2 |
Now plot these x and y values. The graph below shows the eight points (A-H) on the right half of y=36/x. Other points such as (36,1) could also have been plotted as well as non-integer values of x and y, but they will all lie on the red hyperbolic curve.