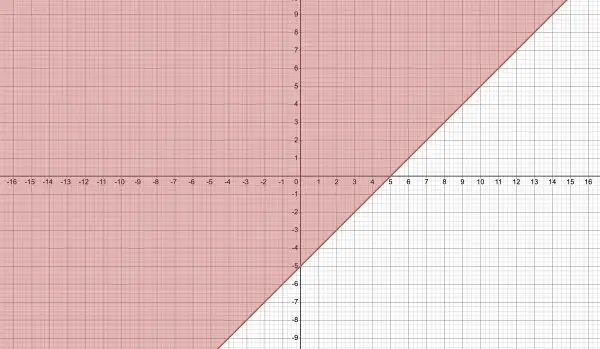
The red line is the graph of y=x-5. Note where the intercepts are on each axis. The shaded area represents the inequality y≥x-5. Inequalities are usually graphed as areas rather than lines. All the points in the shaded area are where the y value equals or exceeds the value of x less 5. For example, when x=6, y can be any value bigger than 1.