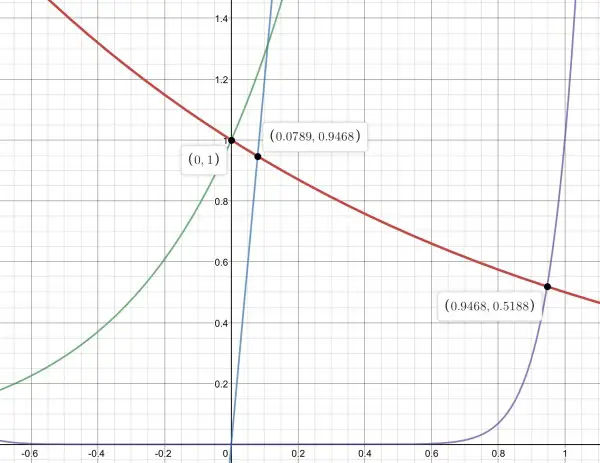
Red is 2⁻ⁿ, Blue is 12n, Green is 12ⁿ, Purple is n¹².
The marked intersection points are solutions to 2⁻ⁿ=12n or 12ⁿ or n¹².
We’ll call these the blue, green and purple solutions, and each can be explained. For all these cases n is a positive fraction. So let’s set up a scenario. The red curve represents a decline in population over a year, so that at the end of a year it’s half of what it was at the beginning. Therefore n represents a time in the year. 12n converts the time to a time measured in months.
BLUE
Means that after about 0.95 months (0.08 of a year) the population has gone down to about 95% of what it was at the start, that is, a reduction of 5%.
GREEN
We can ignore this because it represents the situation only at the beginning, so the green line is a false interpretation of the question.
PURPLE
We can ignore this interpretation, too, because it has no meaning in the context of population decline.
So we are left with the Blue interpretation, which seems quite reasonable.