 The linear equation takes the form Y=A+BX.
The correlation coefficient, r, is 0.9778 approx, which implies a very good correlation between rainfall and yield. When r=1, the correlation is direct and perfect, so 0.9778, being close to 1, implies a good correlation. The coefficient of determination=r²=0.9561 approx and it is a measure of how good the statistical model is (the linear equation).
A=18.69, B=2.52 (approx). The derivation of these is explained below. The picture below shows the regression line in red as the best fit for the given data, represented by points on the graph.
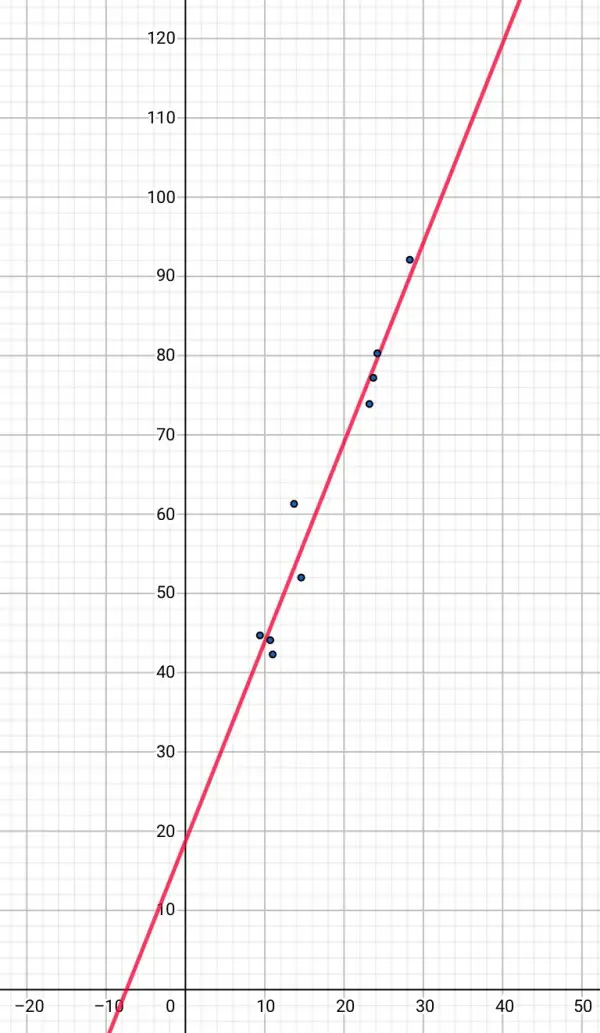
Although the red line is the best fit it clearly does not pass through most of the points, so extrapolation cannot accurately predict yield, given a specific rainfall. It can only be used as a general indication of the yield. For example, no rainfall would still produce a yield according to the graph, whereas, in fact, there may be little or no yield without rain.
CORRELATION COEFFICIENT
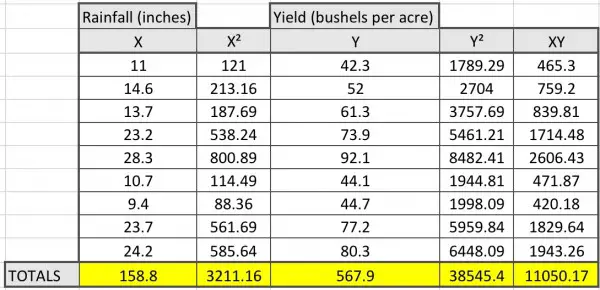
First, we calculate the means of the X and Y values: mean X=158.8/9, mean Y=567.9/9.
Then we subtract mean X from each X value (call this difference p) and mean Y from each Y value (q). For each pair of differences, we find the product (pq). And we calculate the squares of each member of the pair (p² and q²). The next step is to sum the pair products (∑pq) and sum both sets of squares (∑p² and ∑q²). To save space and time, these calculations are omitted.
r=∑pq/√(∑p²×∑q²). Other versions of the formula are available.
LINEAR REGRESSION EQUATION
Using the table total lines we can calculate A and B:
B=(n∑XY-(∑X)(∑Y))/(n∑X²-(∑X)²) where n=9. Other versions of the formula are available.
B=(9(11050.17)-(158.8)(567.9))/(9(3211.16)-158.8²),
B=(99451.53-90182.52)/(28900.44-25217.44)=9269.01/3683=2.5167 approx.
A=(1/n)(∑Y-B∑X)=(1/9)(567.9-158.8B)=18.6942 approx.
Y=18.69+2.52X is the equation of best fit.
STATISTICAL SIGNIFICANCE
We use a t test where the test statistic t=r√((n-2)/(1-r²))=0.9778√(7/(1-0.9561))=12.33 approx.
Using the body of the t table to find the probability (p-value) associated with this t value at 7 DOF, we find that it is beyond 0.001 (0.1%) so it’s highly significant, certainly better than 5% significance. The model for correlating rainfall and wheat yield is highly significant.