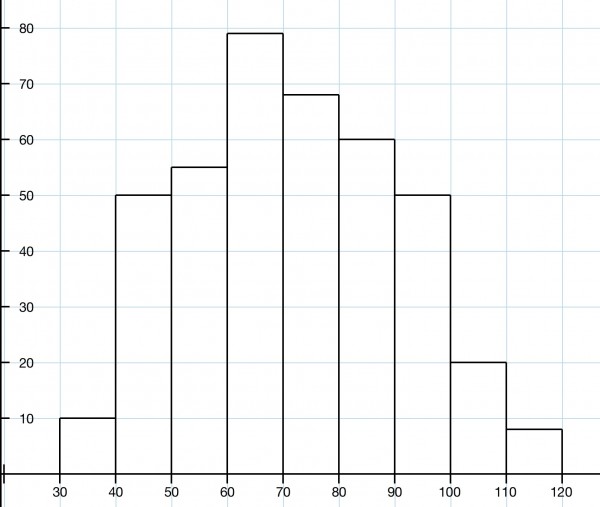
The diameters of a sample of 400 washers produced by a machine are summarised in table

1 below:

Diameter (millimeters)

Number of washers


30 -under 40

10


40 –under 50

50


50 –under 60

55


60 –under 70

79


70 –under 80

68


80 –under 90

60


90 –under 100

50

100 –under 110

20

110 –under 120

8

Total


400

Table 1

Required:


1.1

Draw a Histogram of the above grouped frequency distribution.


1.2

Draw the upward sloping ogive of the above grouped frequency distribution.


1.3

Calculate mode and the median of the above data


1.4

Establish the value of the Standard Deviation of the above grouped frequency


distribution using appropriate computational formulae.


in Statistics Answers by

Your answer

Your name to display (optional):
Privacy: Your email address will only be used for sending these notifications.
Anti-spam verification:
To avoid this verification in future, please log in or register.

1 Answer

Best answer

1.1 HISTOGRAM

1.2 OGIVE CURVE

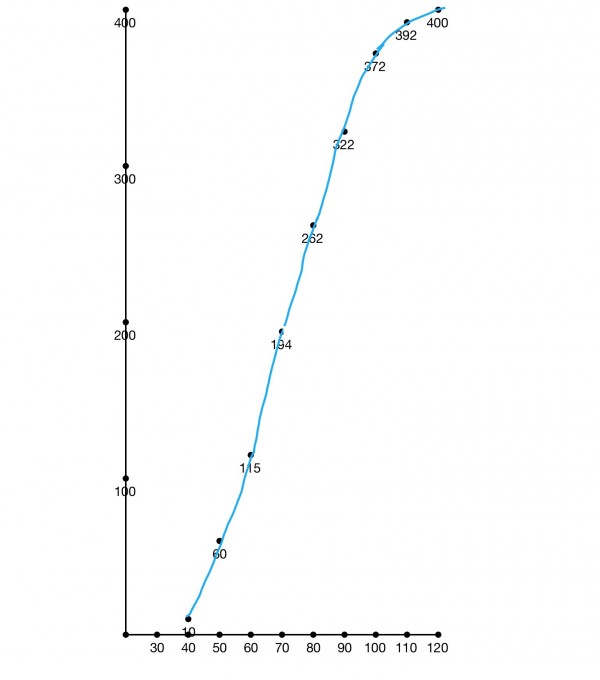
1.3 MODE is the most frequent value=60 to under 70; MEDIAN is the central datum: the central datum is 200 in the ordered set of data, which is 70-80. [An estimate from the ogive curve gives us about 71 (70+10*6/68).]

1.4 To find the SD we need to calculate the mean. I did this be taking the midrange value of the diameter and multiplying by the frequency for each group. For example, 30-40 has a midrange value of 35mm. Multiply this by the frequency: 35*10=350. I then took the sum of all such products: 28730 and divided by the data size 400 to give 71.825mm as the mean. This is close to the median (71mm).

If we use the median as the mean, we can calculate the difference between each midrange value and the mean, square it and multiply by the frequency. We then add all these values together and divide by 400. When we do this we get the variance=360.85. The square root of this is the SD=19mm (approximately).

I don't know if this is the right answer, but I hope it helps.

by Top Rated User (1.2m points)

Related questions

1 answer
1 answer
1 answer
asked Oct 14, 2019 in Statistics Answers by anonymous | 5.2k views
1 answer
asked Oct 13, 2019 in Statistics Answers by anonymous | 1.0k views
1 answer
asked May 13, 2019 in Statistics Answers by anonymous | 379 views
1 answer
asked Feb 17, 2019 in Statistics Answers by anonymous | 508 views
1 answer
asked Nov 19, 2018 in Statistics Answers by anonymous | 477 views
1 answer
1 answer
asked Sep 21, 2017 in Statistics Answers by Stephon | 634 views
0 answers
asked Aug 17, 2017 in Statistics Answers by Blessings Chisale | 245 views
0 answers
asked Aug 17, 2017 in Statistics Answers by Blessings Chisale | 252 views
1 answer
asked Aug 15, 2017 in Statistics Answers by anonymous | 619 views
1 answer
asked May 26, 2017 in Statistics Answers by Blessings Chisale | 670 views
1 answer
asked Nov 3, 2016 in Statistics Answers by mzminx Level 1 User (140 points) | 3.8k views
Welcome to MathHomeworkAnswers.org, where students, teachers and math enthusiasts can ask and answer any math question. Get help and answers to any math problem including algebra, trigonometry, geometry, calculus, trigonometry, fractions, solving expression, simplifying expressions and more. Get answers to math questions. Help is always 100% free!
87,516 questions
100,285 answers
2,420 comments
734,836 users