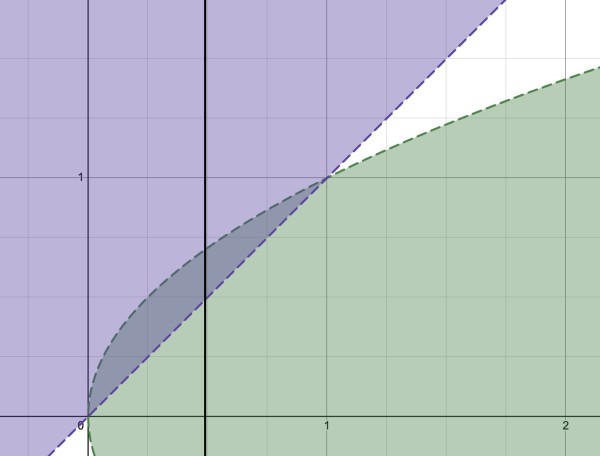
So y2<x<y, that is, x lies between y2 and y.
Consider the graphs y2=x and y=x, which intersect when x2=x, x2-x=0, x(x-1)=0, so x=0 and 1⇒(0,0) and (1,1) are the intersection points.
The curve and the line enclose an area in which both inequalities are satisfied. In this area, 0<x<1 and 0<y<1. For example, when x=0.49, 0.49<y<0.7. 0.7>0.49⇒y>x; y2<0.49⇒y<0.7.
The dark shaded area represents the region in which both inequalities are satisfied. The vertical line is at x=0.49 (example).