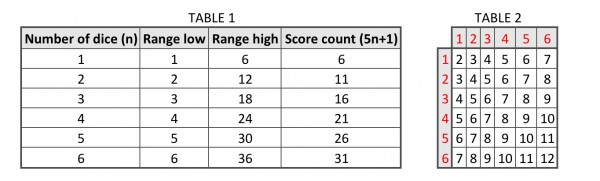
In this problem we're looking for a pattern from which to derive a formula to find the required probabilities. See TABLE 1.
n (the number of dice) determines how many different scores we can get, shown under the score count=5n+1. To find the number of ways of arriving at a particular score, and hence the probability, we need to do further analysis. TABLE 2 shows all possible scores for 2 dice.
S(2,2)=S(2,12)=1; S(2,3)=S(2,11); 2; S(2,4)=S(2,10)=3; ...The individual die scores are shown in red, while the cells are the sums of these scores. There are 62=36 cells in the table and we can list all 11 possible scores as a function S(n,x) where n=number of dice=2 and x is the score. We'll see how the domain x is defined below.
In this case S(n,x)=S(n,7n-x)=x-(n-1)=x+1-n, that is, n=2, and 2≤x≤7.
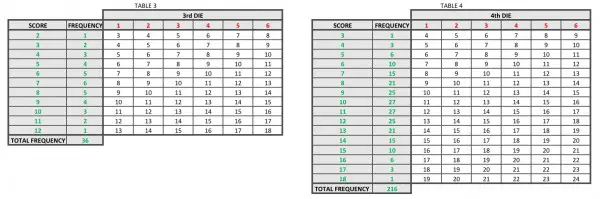
In the first two columns of TABLE 3 we have the scores with their frequencies derived from TABLE 2.
From these frequencies we can calculate probability, P(n,x)=S(n,x)/6n=(x+1-n)/6n. Note that ∑P(n,x)=1 (sum of frequencies=36, shown at the bottom of the first two columns of TABLE 3). So this formula is true for n=2, but not necessarily true for other values of n, although it may be possible to derive a general formula from this formula. ∑P(n,x)=1 always applies to other values of n, but S(n,x) needs to be revised for general usage.
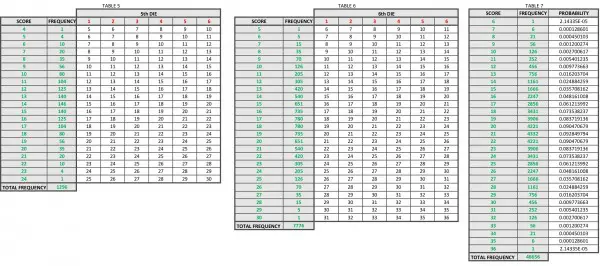
TABLES 4, 5, 6 show the result of adding the 4th, 5th and 6th dice using the same method of calculating frequencies. So TABLE 4 uses frequencies derived from TABLE 3, TABLE 5 uses those from TABLE 4, and TABLE 6 uses those from TABLE 5. The way to do this for TABLE 4, for example, is to inspect TABLE 3 for a specific score in the body of the table and then add together the numbers in the FREQUENCY column. Let's take the score of 7. It appears 5 times in TABLE 3. In the frequency column we have the numbers 1-5, which sum to 15, so in TABLE 4 against 7 in the SCORE column the FREQUENCY column contains 15. This rule applies to all scores in TABLES 4-7.
TABLE 7 provides the frequencies (S) and the probabilities for all possible scores resulting from rolling 6 dice. The probability (P) as a fraction can be found by dividing the frequency by 46656 (66). For example, the probability of the score 21 is 4332/46656=361/3888=0.092849794. A copy of this table follows in the comment. This is the reference table providing the answer to the question.