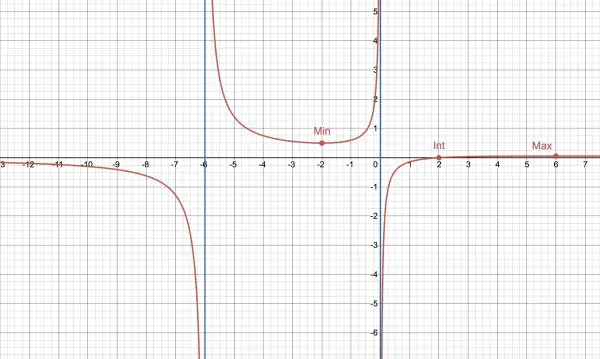
Let y=f(x)=(x-2)/(x(x+6)).
The first step is to identify asymptotes, which are created when the denominator x(x+6)=0, that is, when x=0 (y-axis) and x=-6. These asymptotes are vertical lines. Mark them first.
Horizontal asymptotes are found examining limits for f(x) as x approaches infinity. If X is a very large positive value of x, then the numbers -2 and 6 can be ignored, f(X) approximates to X/X2=1/X, and f(-X)=-1/X. This tells us that for x>0, y approaches the x-axis from the positive side, while for x<0, y approaches the x-axis from the negative side.
Consider the vertical asymptote x=-6. When x is slightly less than -6, let x=-6-h where h is very small and positive, so f(-6-h)=(-8-h)/((-6-h)(-h))=(-8-h)/(h(h+6))≈-8/6h=-4/(3h), which is a large negative number because we are dividing by a small fraction, h. We now have the shape of the curve when x<-6.
Now consider the vertical asymptote which is the y-axis (x=0). Let x=-h, a very small number then f(-h)≈-2/(-6h)=1/(3h), which is a large positive number. Similarly, considering the asymptote x=-6, let x=-6+h, f(-6+h)=-8/(-6h)=4/(3h), a large positive number. From this analysis, for -6<x<0, the graph has a U-shape, because f(x) stays positive over this interval. We can find out if there's a minimum point, differentiate f(x):
f'(x)=(x2+6x-(2x+6)(x-2))/(x2+6x)2=(x2+6x-2x2-2x+12)/(x2+6x)2.
-x2+4x+12=0=-(x2-4x-12)=-(x-6)(x+2), and x=6 and -2 at turning points. So the minimum must be at x=-2, when f(-2)=-4/(-8)=½. Minimum is (-2,½). Now we have a clear picture of the shape for -6<x<0.
f(h)≈-2/(6h)=-1/(3h), a large negative number, and from the above differentiation, x=6 and f(6)=4/72=1/18, making (6,1/18) a maximum. So for x>0, the graph rises from -∞ (the y-axis asymptote) to (6,1/18) and then falling towards the x-axis as x increases. The x-intercept is when x-2=0, that is, x=2, so the curve crosses the x-axis at this point, before it rises to the maximum at (6,1/18) then drops towards the x-axis.
The above analysis describes in detail how to draw the graph consisting of three sections separated by asymptotes.