2y + x = 5; Point1 (1 , -3) Point2 (7 , -1)
First you want to put the equation into y = mx + b form:
To do this subtract x and divide everything by 2:
2y + x = 5
2y = 5 - x
y = 5/2 - 1/2x
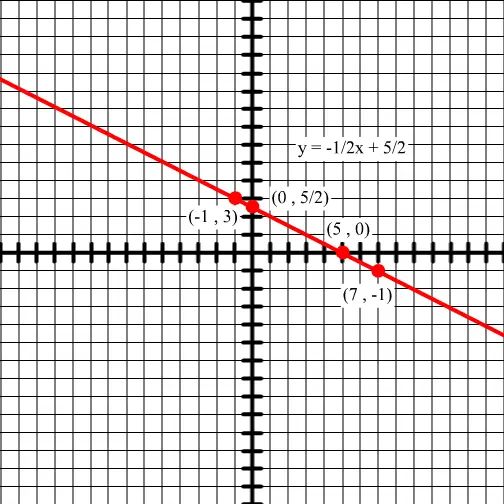
y = -1/2x + 5/2
Now you know the graphable equation. This should be the line that goes through the two points you are given. This equation has a slope of -1/2 and a y-intercept of 5/2.
Actually, I just ran through this equation and the first point isn't associated with the line of y = -1/2x + 5/2.
I have reached this conclusion because if you plug in the values of the first point, the right side doesnt equal the left. Let me show you:
2y + x = 5
Using point (1 , -3)
2(-3) + 1) = 5
-6 + 1 = 5
-5 = 5
-5 does not equal 5 so this point doesn't exist on this line. Maybe there was a type in your title. If the point were (-1 , 3), that point would lie on the line.
2(3) - 1 = 5
If you want the graph of this equation, I'll just assume that you mean (-1, 3) and continue on:
Here is what the graph should look like: