Two methods are included in this solution, both leading to the same result.
(1) y'=dy/dx=(xy+2y-x-2)/(xy-3y+x-3)=
[(xy-3y+x-3)+(5y-2x+1)]/(xy-3y+x-3)=
1+(5y-2x+1)/(xy-3y+x-3).
We need to shift the axes so that the constant terms disappear. This will help to separate the variables.
[Note also that (xy+2y-x-2)/(xy-3y+x-3)=((x+2)y-(x+2))/((x-3)y+(x-3)),
that is: (x+2)(y-1)/[(x-3)(y+1)], which also leads to evaluation of h and k below: (h,k)=(-2,-1) and (3,1). An alternative solution method is shown later.]
Let x=X+h and y=Y+k so y'=dy/dx=dY/dX=Y'.
1+(5Y+5k-2X-2h+1)/(XY+kX+hY+hk-3Y-3k+X+h-3).
5k-2h+1=0, hk-3k+h-3=0; k=(2h-1)/5, h(2h-1)/5-3(2h-1)/5+h-3=0,
2h2-h-6h+3+5h-15=0,
2h2-2h-12=0, h2-h-6=0=(h-3)(h+2)=0⇒(h,k)=(3,1) or (-2,-1).
(h,k)=(3,1):
Y'=1+(5Y-2X)/(XY+X+3Y+3-3Y-3+X+3-3)=1+(5Y-2X)/(XY+2X).
X(Y+2)Y'=XY+2X+5Y-2X=Y(X+5), so the variables can now be separated:
(Y+2)Y'/Y=(X+5)/X,
(1+2/Y)dY=(1+5/X)dX, integrating:
Y+2ln|Y|=X+5ln|X|+C. Since Y=y-k=y-1 and X=x-h=x-3:
y-1+2ln|y-1|=x-3+5ln|x-3|+C, which can be written:
y+2ln|y-1|=y+ln(y-1)2=x+ln|(x-3)5|+K, where K absorbs the other constants.
K can also be absorbed into the log: y+ln(y-1)2=x+ln|a(x-3)5|, where a is a constant.
Since we have a solution using (h,k)=(3,1) there seems to be no point in pursuing (h,k)=(-2,-1). However, you may find it a useful exercise to make the substitution yourself and see where it leads. You would then have two solutions for comparison. They should give the same result.
VERIFICATION
y'+2y'/(y-1)=1+5/(x-3),
y'(y-1)(x-3)+2y'(x-3)=(y-1)(x-3)+5(y-1),
y'(xy-3y-x+3+2x-6)=xy-3y-x+3+5y-5;
y'(xy-3y+x-3)=xy+2y-x-2;
y'=(xy+2y-x-2)/(xy-3y+x-3)✔️
[ALTERNATIVE SOLUTION (PROBABLY THE PREFERRED METHOD)
dy/dx=(x+2)(y-1)/[(x-3)(y+1)],
((y+1)dy/(y-1)=(x+2)dx/(x-3) (variables are now separated),
(y-1+2)dy/(y-1)=(x-3+5)dx/(x-3),
(1+2/(y-1))dy=(1+5/(x-3))dx, integrating:
y+ln|y-1|=x+5ln|x-3|+C. This is the same solution as before, but it's a faster method.]
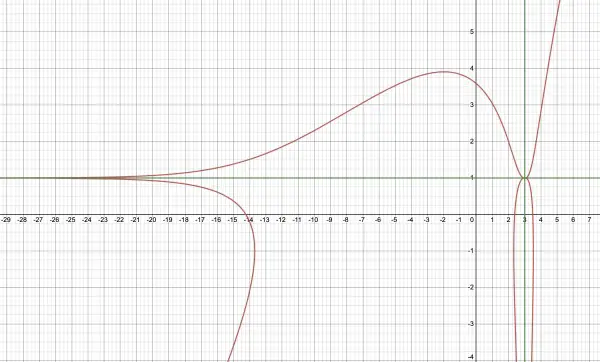
(2) The domain of y+2ln|y-1|=x+5ln|x-3|+K is x≠3, so x=3 is a vertical asymptote (shown in green in the picture, courtesy of Desmos.com).
(4) It's not clear from the picture below, but the vertical asymptote separates the curves left and right of it. The horizontal asymptote at y=1 is also shown and separates the curves above and below it.
This is a graph where K=0. If the absolutes are not included in the log arguments the graph is not as interesting.
I don't have access to MATLAB to apply to the other questions.
(3) Below is a family of curves with varying values of K (including K=0). Positive values of K raise the curve higher over the x-axis.
Around K=-6 there is a dramatic change below the x-axis (see purple and black curves). Also, the curves get closer to the horizontal asymptote.
K=2 is orange; K=-1 is red; K=-4 is blue; K=-6 is purple; K=-8 is black.
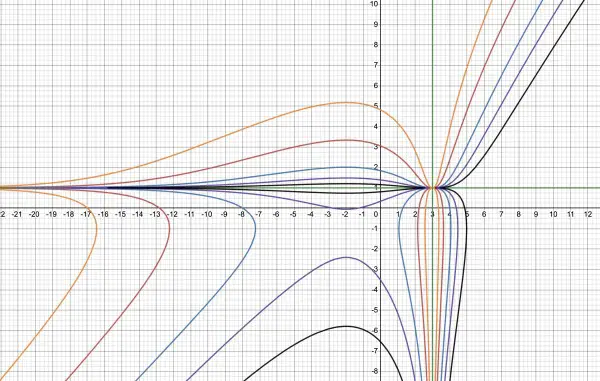
The intervals of interest seem to be around -5<x<3 because of the appearance of the extra "hump" below the x-axis which does not appear when K>-5.66 (approx). The hump is created as the two sections of the curve below the x-axis get closer together then "flips" to become new curves. At the same time the part of the curve near the horizontal asymptote starts to "hug" it. The "flip" point can be determined more accurately by expanding the horizontal scale between -3 and -1 and adjusting K to between -6 and -5.
Another interval of interest is around the vertical asymptote at x=3. The curve on either side of the asymptote is fairly close to it for values of K quite close to zero (within a few units). By expanding the horizontal scale, the behaviour of the curve close to the asymptote can be observed more closely.
I hope this helps.