You may have missed an exponent on the first term, but the way to graph this is to set up a table of x and f(x) values.
Let’s assume that f(x)=x³+6x²+6x-7. It doesn’t matter if the first term x³ is correct or not because the question asks how to draw the graph, not to actually draw it.
The first x value in the table should be 0 because this value will give you the y-intercept—where the curve crosses the y-axis where y=f(x) as the vertical axis. x is the horizontal axis.
So we have the start of the table:
x f(x)
0 -7
-7 is the constant part of f(x) which is the point on the y-axis 7 units below the origin where the two axes meet.
Next pick some easy values of x to help you find other points on the curve. 1 and -1 are easy values. For x=1, replace each x term by 1: f(1)=1+6+6-7=6.
f(-1)=-1+6-6-7=-8. The constants are the same, but odd exponents of x are negative. Now the table looks like:
x f(x)
0 -7
1 6
-1 -8
To mark these points on the graph: for x=1, move 1 unit to the right of the origin on the x-axis then go 6 units straight up and mark the point.
For x=-1, move 1 unit to the left of the origin then go 8 units straight down and mark the point. You will begin to realise how much room you need to draw the graph without going over the edge of the graph paper. In this case y goes from 6 to -8 which is 14 units tall so the scale of the graph must be able to accommodate these limits. And other values may require a greater range.
Now add a few more values to the table. I’ve added 2 and -2:
f(2)=8+24+12-7=37, f(-2)=-8+24-12-7=-3.
x f(x)
0 -7
1 6
-1 -8
2 37
-2 -3
You can see that the range now goes from -8 to 37, which is 45 units tall but only -2 to 2, 4 units wide. So the vertical units are shorter than the horizontal units. You may find that the table looks better if you put the x values in order along with the corresponding f(x) values. So you would have:
x f(x)
-2 -3
-1 -8
0 -7
1 6
2 37
Keep filling the table until you get a good idea of the shape of the curve. Don’t just join the points you plot, because the curve will be smooth so you may need a calculator to plot some intermediate points as the curve twists and turns.
Good luck!
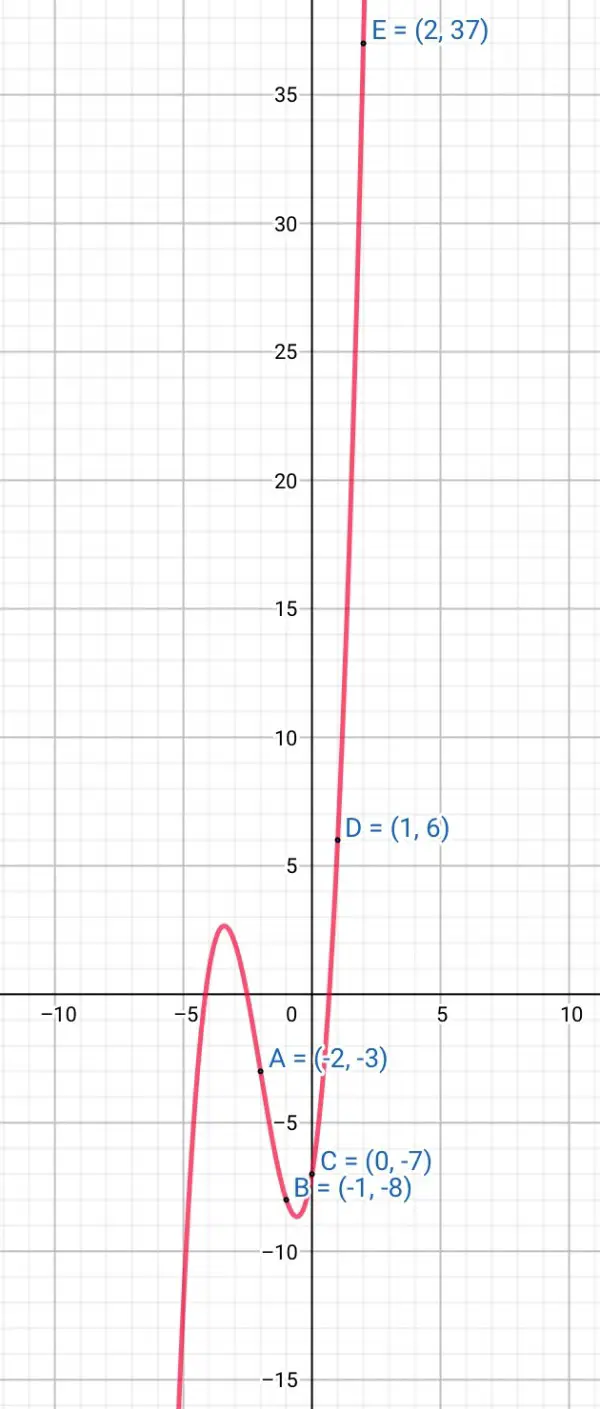
Below is the graph of my example for f(x) with the points A, B, C, D, E plotted according to the table. You can see what other values would be needed to get the right shape.