First a picture to make things clearer:
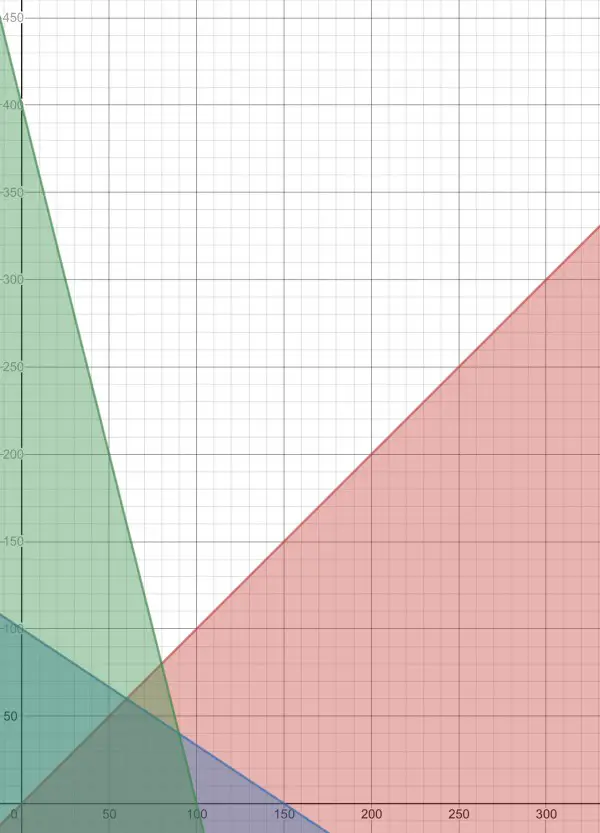
CONSTRAINT 1 is blue, CONSTRAINT 2 is green, CONSTRAINT 3 is red. CONSTRAINTS 4 and 5 mean that we only consider the first quadrant of the graph. The blue, green and red lines are the constraint equations shown graphically, while the shaded regions represent the inequalities. Where all three shaded regions overlap is the feasible region, and we just need the vertices of this region, which form a quadrilateral with one vertex at the origin.
We need the coordinates of the vertices. A vertex is formed where two lines intersect.
The equations we use can be written:
y=100-⅔x (blue), y=400-4x (green), y=x (red).
Red and green intersect when 400-4x=y=x; solve 400-4x=x, 5x=400, x=80=y. Intersection is (80,80), but this is outside the feasible region. Red and blue intersect when 100-⅔x=y=x; solve 100-⅔x=x, 5x/3=100, x=60=y. This point (60,60) is a vertex of the feasible region.
Green and blue intersect at another vertex of the feasible region:
100-⅔x=y=400-4x; solve 100-⅔x=400-4x, 10x/3=300, x=90, so y=400-360=40, the point (90,40).
The other two vertices are at (0,0) and (100,0).
Now we substitute these pairs of values into the revenue expression R=1.95x+2.25y:
(0,0): R=0 (no-brainer!)
(100,0): R=$195
(60,60): R=$117+$135=$252
(90,40): R=$175.50+$90=$265.50–that’s the maximum revenue. 90 standard and 40 deluxe.
You should now be able to fit this solution into the framework of the expected answers to the questions.