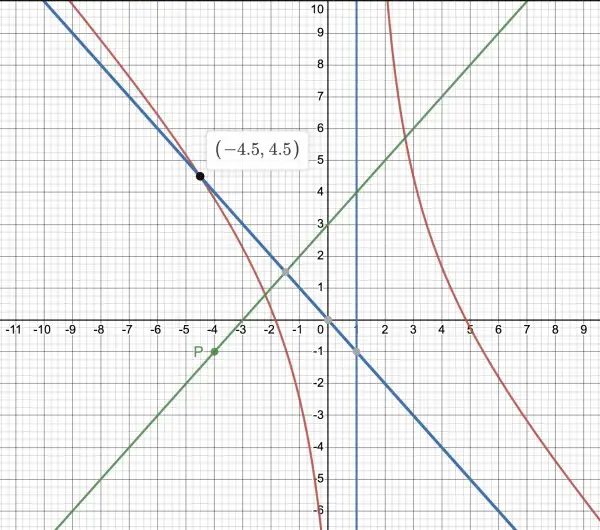
f(x) is the green line; the red curves represent g(x).
f(x)=(x2+7x+12)/(x+4) which can be written:
f(x)=(x+4)(x+3)/(x+4)=x+3 when x≠-4, hence its apparent linearity. However, at the point P(-4,-1) there is a hole because f(x) is undefinable at x=-4 (x+4=0 makes the denominator zero). To draw the graph just mark the intercepts on the axes: x-intercept when y=0, x=-3; y-intercept when x=0, y=3. Draw a line through these intercepts.
For g(x) we need the asymptotes. The vertical asymptote is x=1 (blue vertical). The curve on either side of this asymptote approach it on the left as x→1 (y→-∞) and on the right (y→∞). The other asymptote is y=-x (blue sloping line) found by evaluating g(X) where the magnitude of X is large so g(X)~-X2/X, g(X)~-X. when X>0, the red curve approaches this asymptote; when X<0, the curve approaches the asymptote after intersecting it. To find this intersection we solve g(x)=-x, that is:
y=(-x2+3x+9)/(x-1)=-x,
-x2+3x+9=-x(x-1)=-x2+x,
2x=-9, x=-9/2⇒y=9/2, the point (-4.5,4.5) shown.
The x-intercepts are found by solving g(x)=0, that is, x2-3x-9 (using the quadratic formula), x=(3±√(9+36))/2=(3±3√5)/2, x=4.854 and x=-1.854 approx.
With this behavioural information, f(x) and g(x) can be sketched. Plotting a few arbitrary points helps.
DOMAIN AND RANGE
For f(x) the domain is x≠-4, that is, x∈(-∞,-4), (-4,∞); range is (-∞,∞).
For g(x) the domain is x≠1, or x∈(-∞,1), (1,∞); range is (-∞,∞).
ASYMPTOTES
f(x) has no asymptotes but has a hole at (-4,-1).
Asymptotes for g(x) are x=1 and y=-x.
A slant asymptote occurs when the highest degree of the numerator is 1 greater than that of the denominator.
