Type I feed: 8g fat + 12g carbohydrate + 2g protein (per 20c unit)
Type II feed: 12g fat + 12g carbohydrate + 1g protein (per 30c unit)
Let x=amount of Type I and y=amount of Type II in the mixture.
(a) Mixture constraints:
x+y≤5 (unit consumption)
8x+12y≥24 (fat consumption) simplifies to 2x+3y≥6
12x+12y≥36 (carbohydrate consumption) simplifies to x+y≥3
2x+y≥4 (protein consumption)
(b) Objective function: $z=0.20x+0.30y (to be minimised).
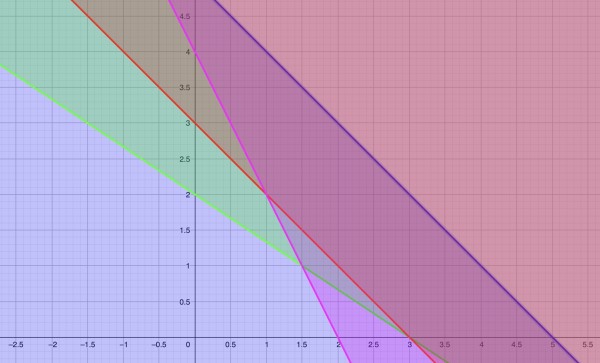
(c) The graph below represents the inequalities:
The shaded region on and to the left of the blue line represents x+y≤5.
The other lines represent the other inequalities and it's the regions to the right of each of these lines we are interested in. Both x and y must be positive (including zero); negative values have no meaning.
Green line: 2x+3y≥6; red line: x+y≥3; pink line: 2x+y≥4.
The lines intersect: green/pink (1.5,1); pink/red (1,2); green/red (3,0). All these points are within the blue region (x+y≤5). The red and blue lines are parallel. The only region satisfying all the inequalities is between x=3 and x=5. When x=3, y=2 (the point (3,2)). The triangular feasible region is bounded by (3,0), (3,2), (5,0).
(d) If we plug these values into the objective function z=0.20x+0.30y, we get: z=$0.60 for (3,0), $1.20 for (3,2), and $1 for (5,0).
The minimum is z=$0.60, so that's 24g fat, 36g carbohydrate, 6g protein. These satisfy the constraints at minimum cost of 60c: 3 units of Type I feed and none of Type II.
