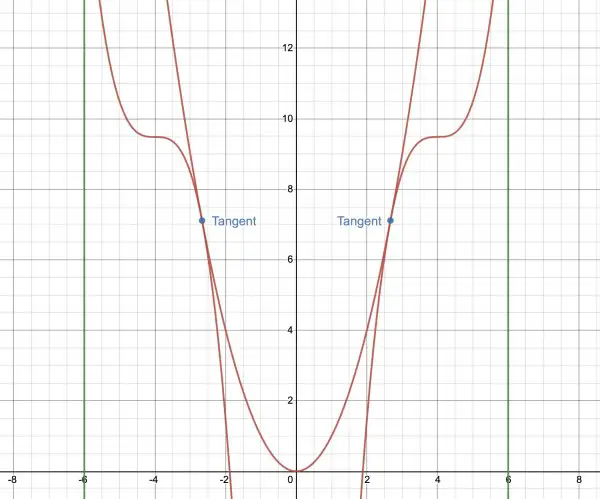
The graphical representation shows the limits a and b (-6 and 6 shown as green lines) as an example. The actual graph consists of three parts (piecewise function). The central part shows the minimum, while the other two turning-points are points of inflection. The sketch of the graph would trace the curve from the left joining the central part at the first tangent point and following this curve till it meets the third curve at the other tangent point. Other parts of the curves should be ignored (they are just construction lines).
f(x)=
{ -(x+4)3+256/27 | x<-8/3
{ x2 | -8/3≤x<8/3
{ (x-4)3+256/27 | x≥8/3
The extraneous lines show the three component parts of f(x) in their fuller form.
The graph is one of many that could have been presented.
