There are 19 different values for k: 0-18. The distribution is symmetrical. For example, there is only one way that k can be 0 (00) and one way k can be 18 (99). There are two ways k can be 1 (01, 10) and two ways k can be 17 (89, 98). There are three ways k can be 2 (02, 11, 20) and three ways k can be 16 (79, 88, 97).
There are 10 ways k can be 9 (09, 18, 27, 36, 45, 54, 63, 72, 81, 90). This means the probability of k=9 is 10/100=10%. So, p(k)=(k+1)/100 or (k+1)%, for k<10, and p(k)=(19-k)/100=(19-k)% for k≥10.
The sum of the frequencies 1-9 is 45, so, the total probability (all outcomes) is 2×45+10=100%.
p(k)=(10-|9-k|)/100 for 0≤k≤18 is a way of expressing the probability in a single equation. p(k) peaks when k=9, the apex or vertex of the distribution.
The graph below shows the distribution:
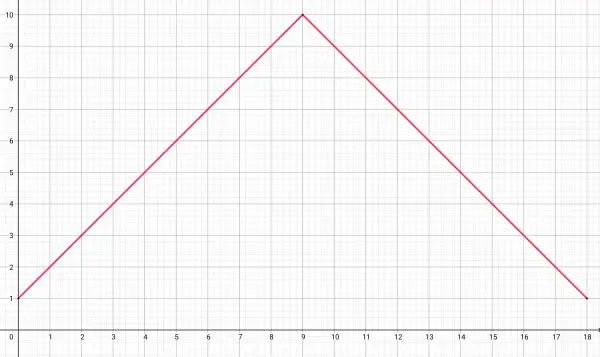
To read this graph of p(k), consider only integer inputs and outputs. On the graph, the y-axis represents percentages (for convenience). The area under the triangle is 100%, the sum of the probabilities. You can verify this by counting the squares (the two triangles at the ends of the rows combine to make a square): from top to bottom 1+3+5+7+9+11+13+15+17+19=100 (the red triangle needs to be extended to the x-axis).