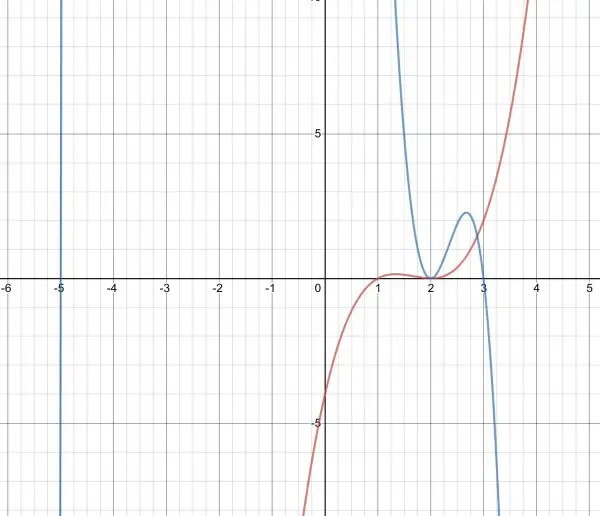
For f(x)=(x-1)(x-2)²: (red graph)
End behaviour: f(x)→x³ when x is very large. Simply ignore the constants 1 and 2, so we just add the powers of x. That gives us 3. When x is large and positive, f(x)→∞; when x is large and negative, f(x)→−∞.
x-intercepts: x=1 and x=2 because these values make f(x)=0.
y-intercepts: (-1)(-2)²=-4. There is only one y-intercept at y=-4. This is the value of f(0).
(a) Intervals: (−∞,1), f(x)<0 (below the x-axis); (b) [1,2], f(x)≥0 (on or above the x-axis); (c) (2,∞), f(x)>0 (above the x-axis).
(a) example: f(-1)=-18; (b) example: f(1.5)=0.125; (c) example: f(3)=2.
For f(x)=-2(x-3)(x+5)(x-2)²: (blue graph)
End behaviour: f(x)=-2x⁴. When x→±∞, f(x)→−∞.
x-intercepts: -5, 2, 3
y-intercept: -2(-3)(5)(4)=120
Intervals:
(−∞,-5): f(x) is (-)(-)(-)(+)=negative; example: f(-6)=(-2)(-9)(-1)(64)=-1152.
[-5,2]: f(x) is (-)(-)(+)(+)≥0; example: f(1)=(-2)(-2)(6)(1)=24.
[2,3]: f(x) is (-)(-)(+)(+)≥0; example: f(2.5)=(-2)(-0.5)(7.5)(0.25)=1.875.
(3,∞): f(x) is (-)(+)(+)(+)≤0; example: f(4)=(-2)(1)(9)(4)=-72.